 We set out to understand whether long-term care home (LTCH) provider type made a difference for COVID-19 outcomes. Our recently published paper, “Does the Profit Motive Matter? COVID-19 Prevention and Management in Ontario Long-term Care Homes”, finds that for-profit LTCHs did the worst job of protecting life during the pandemic. But nonprofits were not much better. The data reveal that government LTCHs were associated with the best COVID-19 management outcomes, while nonprofits were in the middle.
Context
The preventable death of long-term care residents from COVID-19 has occurred across the country. But the situation is perhaps starkest in Ontario. As of May 2021, 3762 long-term care home residents and 11 staff members have died from COVID-19.[i] This is extremely high considering that there are a total of 78 824 bed spaces in Ontario long-term care. COVID-19 deaths in long-term care, thus, comprise five percent of total bed spaces in the system.[ii] During the first peak of the pandemic, Ontario experienced a 28% increase in excess mortality among its long-term care residents—amounting to 1883 more deaths than would usually have occurred.[iii] In addition to the spread of COVID-19, residents also suffered from grotesque neglect: in one home, 26 residents died from dehydration before military personnel arrived.[iv]
We could go on. The pandemic response in long-term care is a humanitarian catastrophe and a policy failure at multiple levels. But some LTCHs have done a better job at infection prevention and management than others. We set out to understand whether provider organization type was a meaningful driver of variation in COVID-19 prevention and management.
Governments Best, For-profits Worst: Our Findings on Provider Type and COVID-19 Management
Overall, we found that government long-term care homes were safer hands in managing the COVID-19 pandemic in Ontario, compared with for-profit and nonprofit providers. For-profits were least able to manage outbreaks, while nonprofits performed in the middle. The subsections below explain the methods used and expand on key results.
Research Methods
To assess the responses of long-term care homes to the pandemic, we used three different measures of the ability of homes to prevent:
- outbreaks from occurring,
- deaths once an outbreak had occurred, and
- deaths accounting for both their ability to prevent outbreaks and to prevent deaths once an outbreak had occurred.
We focus on the last of these measures in this post, though the others are discussed in depth in our paper. We started by analyzing the average number of deaths in for-profit, nonprofit, and government homes, using data published by the Ministry of Health and Long-Term care as of February 11, 2021.
Averages on their own, however, can hide the impact of other factors that can affect the ability of a long-term care home to prevent and manage an outbreak. To account for these factors, we ran zero-inflated binomial regression models that included controls for number of bed spaces, the design standard, a range of performance indicators, and the home’s region. This allowed us to isolate the impact the type of operator had on a home’s performance from these other factors that may have also affected performance.
Summary of Key Results
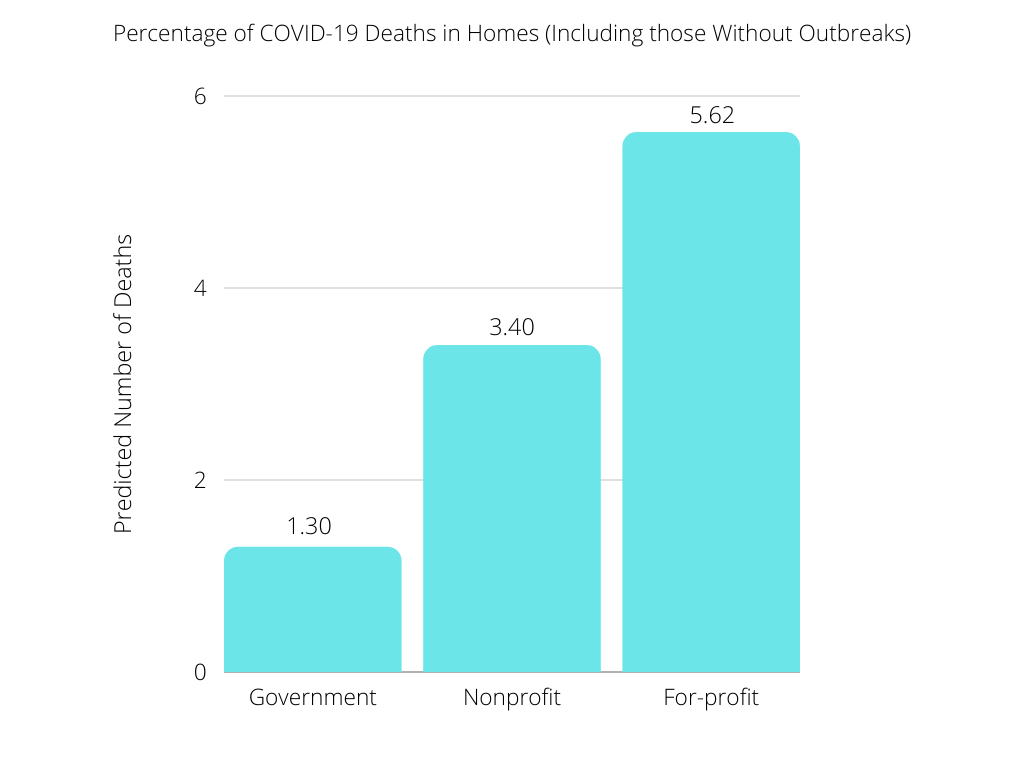
Our results suggest that nonprofit homes occupy a middle position between government homes (which perform best) and for-profit homes (which perform worst). The first figure below shows the average number of deaths in each type of home as a percentage of the number of beds in the home. The average percentage of deaths in a nonprofit home was 3.40% as compared to 1.30% in government run homes and 5.62% in for-profit homes.

This figure includes means with no other variables controlled for. Differences for all three are statistically significant using at least the 95% confidence level (statistical significance was tested using a t-test for differences in means).
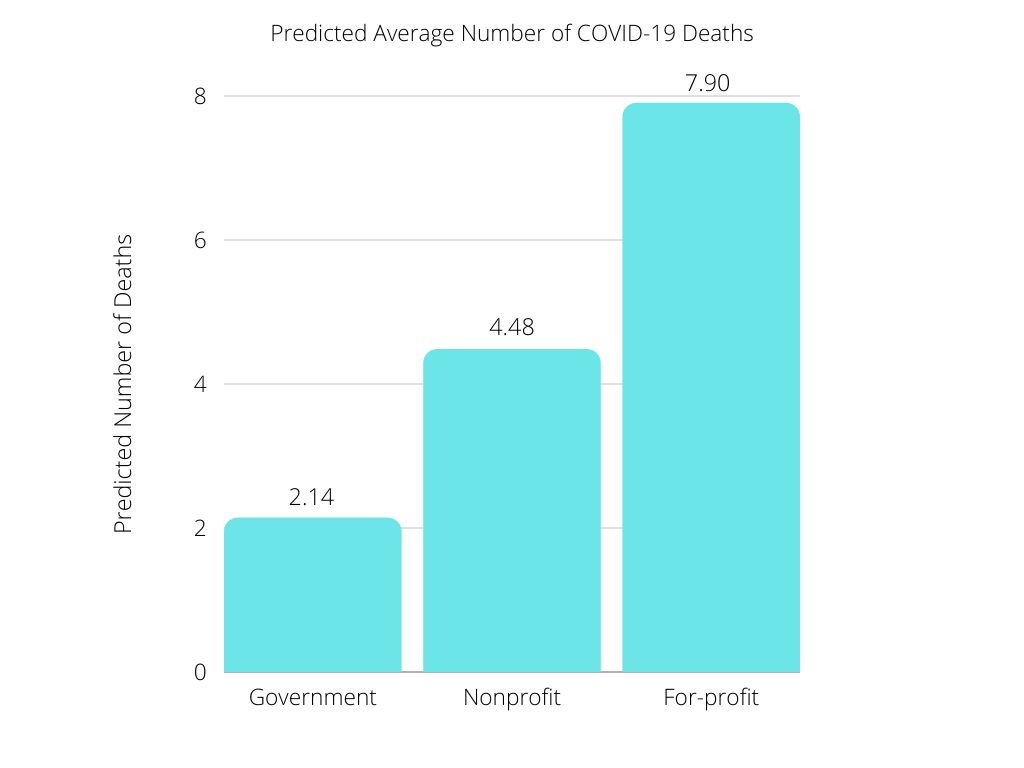
The regression models also suggest that nonprofit homes occupy a middle position between government and for-profit homes. These models can be used to estimate the number of deaths that would occur in a home if all of the other variables we controlled for are held constant. The estimates for each home are shown in the figure below.
If the other factors we control for are held constant, we estimate that an average nonprofit home would have experienced 4.48 deaths as compared to 2.14 for the average government run home and 7.90 for the average for-profit home. These differences are large when one considers the number of long-term care homes in Ontario. There are 337 for-profit, 172 nonprofit, and 99 government run homes. If the for-profit homes were nonprofits homes instead, we estimate that 1153 people would not have died. Had all homes had been government run homes, we estimate 2343 people would not have died —representing a predicted reduction by more than half of the deaths actually experienced.[v]

This figure shows predictive margins based on model 3 in table 4. Differences between each home type are statistically significant at the 95%
Why Are Nonprofits in the Messy Middle?
Nonprofits outperformed for-profits in infection management yet were less effective than government. Our finding that nonprofits perform in the middle offers a novel contribution to public service contracting research. Understanding why, however, is bit of a puzzle.
We clearly cannot rely on a common bogeyman—the profit motive—to explain nonprofits’ poor performance relative to government. The profit motive would only explain the poor performance of nonprofit-owned long-term care homes that subcontract management to for-profit operators. Instead, there are at least two other possible explanations, which we introduce in the paper: capacity to invest in the future and cross-subsidization.
Nonprofits face structural constraints in being able to invest in the future, as well as to absorb crisis events. For example, other research has documented how difficult it is for nonprofits to borrow money. The middling performance of nonprofits may reflect a struggle to react to the pandemic in light of these structural disadvantages.
Another possible explanation that we present in the paper is cross-subsidization. Whereas a for-profit will run into problems if it continually operates at a loss, nonprofits and governments have the ability to do so. In theory, then, both nonprofits and governments can access external resources that enables them to put more resources into service quality. Governments can cross-subsidize with tax revenue, while nonprofits can cross-subsidize with philanthropic donations. Nonprofits might be middling performers because they can cross-subsidize, but perhaps not as effectively as municipal governments.
However, we know very little about how relevant these external revenue sources are in reality. We found some cursory evidence that municipal long-term care homes may be cross-subsidized more than nonprofit homes—philanthropic revenue seems to be 5% or less of nonprofit long-term care home revenue in most cases. But future research should tease out this possibility in more detail.
And, of course, there is a normative implication here: if cross-subsidization is what makes government long-term care homes best, that would be a clear indicator that provincial funding and regulated user fees are insufficient to cover the real cost of long-term care. Rather than relying on philanthropy and local government to fund resident safety on an ad hoc basis, provincial funding levels should be re-evaluated
This article was written by Kristen Pue, Daniel Westlake, and Alix Jansen.
[i] Government of Ontario. (10 May 2021). Long-term Care Homes. Queen’s Printer for Ontario. https://covid-19.ontario.ca/data/long-term-care-homes (10 May 2021).
[ii] Office of the Auditor General. (April 2021). COVID-19 Preparedness and Management: Special Report on Pandemic Readiness and Response in Long-term Care. Toronto, ON: Office of the Auditor General.
[iii] Canadian Institute for Health Information (CIHI). (2021). The Impact of COVID-19 on Long-term Care in Canada: Focus on the First Six Months. Ottawa, ON: CIHI.
[iv] Ontario’s Long-Term Care COVID-19 Commission (LTC Commission). (30 April 2021). Ontario’s Long-Term Care COVID-19 Commission: Final Report. Toronto, ON: LTC Commission.
[v] To calculate this, we multiplied the number of homes of each type by the difference in estimated deaths between each type of home.

